Latner Documentation

CRM Dashboard

The CRM Dashboard puts your sales pipeline on one screen - what your reps have been doing, how many quotes are coming in, which accounts you are winning, and where the quotes you lose are going.

Overview

Most of what a sales manager wants to know is already in Latner; it's just spread across activities, quotes, accounts and contracts. The CRM content on the Dashboard pulls it together. There are actually two tabs, and it's worth knowing which is which: CRM is a set of live lists you work from day to day, and CRM Dashboard is the charts - the same data counted up and grouped however you want to see it.

  • Both are tabs on the Dashboard rather than screens of their own, and each has its own permission, so a rep can have one without the other.

  • The CRM tab shows four lists: overdue activities, recently completed activities, upcoming activities, and accounts converted this month. Every row links straight through to the record.

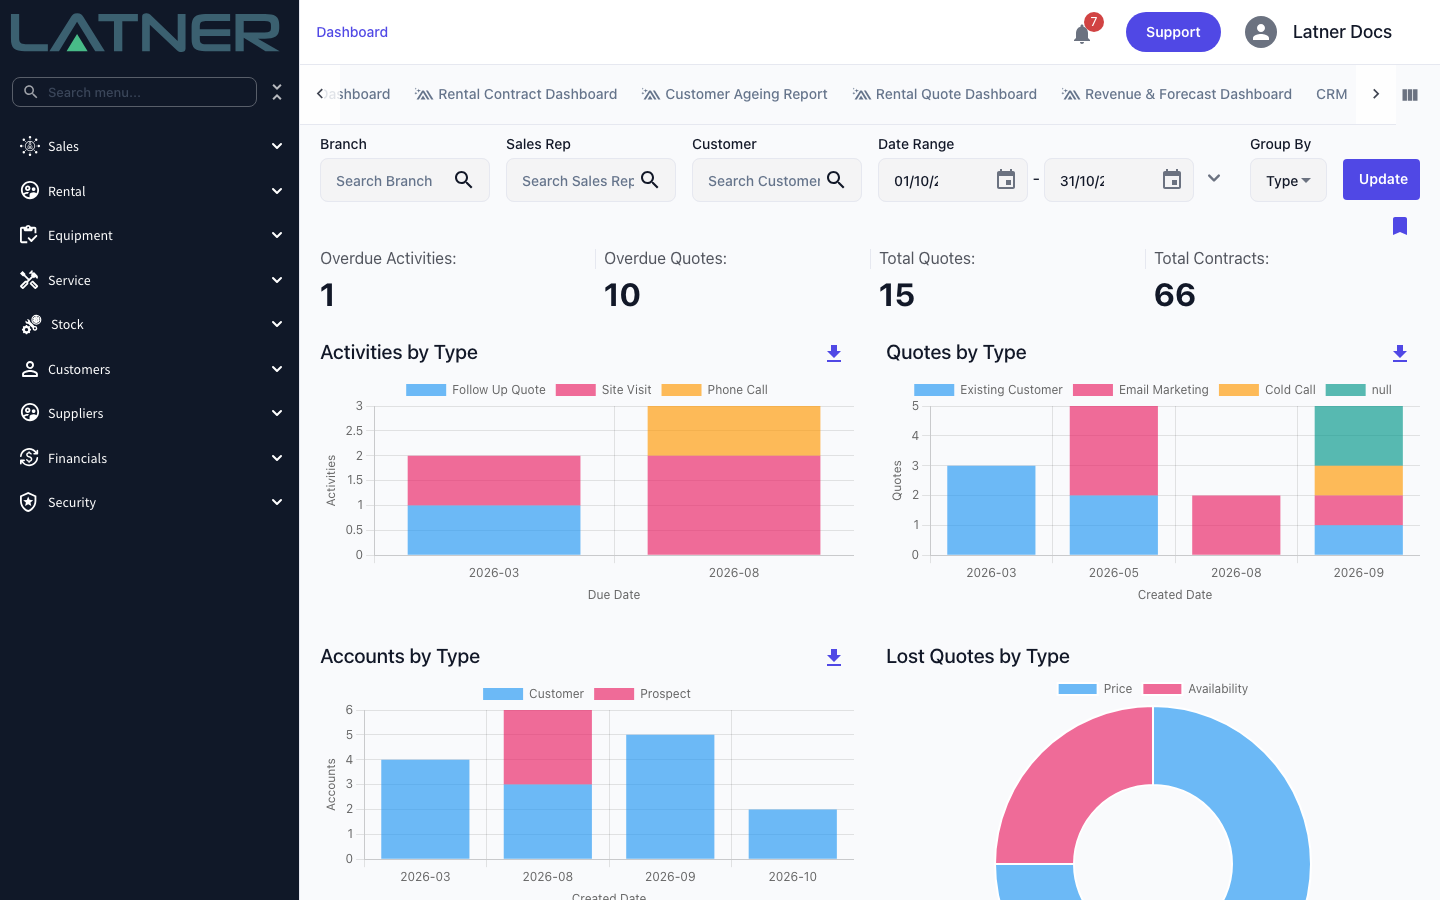
  • The CRM Dashboard tab shows four headline counts and four charts, filtered by branch, sales rep, customer and date range.

  • One Group By setting drives all four charts at once - Branch, Sales Rep, Status or Type.

  • Nothing on the charts redraws until you select Update, so you can set several filters before anything reloads.

  • Filter sets can be saved and reloaded by name, and the bar charts can be downloaded as CSV.

Before You Begin

There's no setting to switch on - the CRM content reads data you already have, so it's just a question of access.

Requirement

Where to Find It

The CRM Dashboard permission, for the CRM lists tab

Security › Configuration › Permission Groups, then the Sales › Screen module

The CRM Dashboard Charts permission, for the CRM Dashboard charts tab

Security › Configuration › Permission Groups, then the Sales › Screen module

The Rental Quotes permission, for the two quote charts

Security › Configuration › Permission Groups, then the Rental › Screen module

Activities logged against your accounts

Sales › CRM › Activities - the activity charts and all three activity lists are built from these

A sales rep on your accounts and quotes

The Sales Rep field on the account and on the rental quote - without it, records land in a No Sales Rep Assigned bucket

01-permissions.png
The two CRM permissions sit side by side under Sales › Screen, so you can give a rep the lists without the charts

Both quote charts and the accounts chart are branch aware. You only see accounts, quotes and contracts for the branches your permission group covers, whatever you pick in the Branch filter.

Using the CRM Dashboard

Step 1 - Open the CRM Dashboard tab

Go to Dashboard and look along the tab strip for CRM Dashboard. There are a lot of tabs and the strip scrolls, so the quickest way to find it is the small icon at the right-hand end of the strip, which opens Reorder/Hide Tabs. Drag CRM Dashboard to the front if you use it every day, or untick the tabs you never open.

02-tabs.png
Reorder/Hide Tabs lists every tab you have access to, with CRM and CRM Dashboard next to each other

Step 2 - Read the headline numbers

Four counts sit above the charts. They answer slightly different questions, so it's worth knowing exactly what each one counts.

  • Overdue Activities - activities created inside the date range that are still Not Started or In Progress and whose due date and time has already passed.

  • Overdue Quotes - rental quotes created inside the date range that are still Open, Quoted or Lost and whose rental start date has already passed.

  • Total Quotes - every rental quote created inside the date range, whatever its status.

  • Total Contracts - rental contracts for the selected branch and customer.

04-crm-dashboard.png
The CRM Dashboard as it opens: the last thirteen months of data, grouped by Type

Total Contracts is the odd one out. It responds to Branch and Customer, but it is not limited by the Date Range or the Sales Rep filter, so it counts every rental contract for that branch and customer rather than just the ones in the period on screen. Read it as a book of business figure, not a figure for the period, and use the Rental Contract dashboard tab if you need contracts counted by date.

Step 3 - Narrow the view with the filters

The filter bar runs across the top. Branch, Sales Rep and Customer all take more than one value, so you can compare two reps or two branches in the same chart.

  • Branch - for quotes and contracts this is the branch on the record; for activities and accounts it's the branch on the account.

  • Sales Rep - the rep on the activity, quote or account. It has no effect on Total Contracts.

  • Customer - the account the activity, quote or contract belongs to.

  • Date Range - two date boxes, plus a chevron that offers the usual presets: Current Month, Current Quarter, Current Financial Year, Last Month, Last Quarter, Last Financial Year, Month to Date, Quarter to Date, Financial Year to Date and Last 6 Months. It opens on the first day of this month a year ago through to the end of this month.

05-daterange.png
The date range presets, which are the fastest way to line the dashboard up with a reporting period

The charts only ever read the last twelve months, counted back from the first of the current month. Setting the date range further back won't bring older activities, quotes or accounts into the charts.

Step 4 - Choose how to group the charts

Group By sets the coloured breakdown on all four charts at once. Type is the default, and it means something different in each chart - which is what makes it useful.

  • Branch - the branch on the record, or on the account for activities.

  • Sales Rep - the assigned rep, with everything unassigned collected under No Sales Rep Assigned.

  • Status - activity status, quote status, or account status depending on the chart.

  • Type - the activity type on the activities chart, the quote source on the quotes chart, Customer or Prospect on the accounts chart, and the lost reason on the lost quotes chart.

06-groupby.png
Group By offers Branch, Sales Rep, Status and Type, and applies to all four charts together

Step 5 - Select Update and read the charts

Nothing reloads until you select Update. The three bar charts stack their groups month by month; the fourth is a doughnut.

  • Activities by ... - activities plotted against the month they are due, not the month they were created.

  • Quotes by ... - rental quotes plotted against the month they were created.

  • Accounts by ... - accounts plotted against the month they were created, which is how you watch prospects turning up.

  • Lost Quotes by ... - a doughnut of quotes created in the range that ended up Lost. Left on Type it splits them by lost reason, which is usually the most useful view on the page.

Hover any bar to see the exact numbers for that month, and use the download icon beside a bar chart's title to save its data as a CSV named after the chart. The doughnut has no download icon.

07-salesrep.png
The same four charts grouped by Sales Rep - useful for a one-on-one, and it shows up unassigned work straight away

Step 6 - Save a filter set you use often

Once the filters and grouping are how you like them, select the bookmark icon under the Update button, type a name and select Save. Selecting a saved name later puts every filter, the date range and the grouping back and reloads the charts. To remove one, select the cross next to its name and then the bin icon that replaces it.

08-savedfilters.png
A saved filter set - selecting its name restores the filters, the date range and the grouping in one go

Saved filter sets are shared, not personal. Everyone who can open the CRM Dashboard sees the same list, and a name can only be used once, so it's worth naming them for the view rather than for yourself - Sydney - by Sales Rep rather than My view.

The CRM Tab

The CRM tab is the working list next door to the charts. It has no filters of its own - each list is a fixed question - and every row links through to the activity or account it came from.

  • Overdue Activities - still Not Started or In Progress, with the due date and time already past. Oldest first.

  • Recently Completed Activities - completed in the last seven days, most recent first.

  • Upcoming Activities - still Not Started or In Progress and due today or later.

  • Accounts Converted This Month - prospects that became customers since the first of the current month, with the rep who converted them.

03-crm-tab.png
The CRM tab - four fixed lists, each row linking straight to the activity or account

FAQs

There's no CRM Dashboard tab on my Dashboard. Where is it?

The two CRM tabs appear only for users whose permission group has the matching permission, under Sales › Screen: CRM Dashboard for the lists tab and CRM Dashboard Charts for the charts tab. If you can see one but not the other, that's why. Also check Reorder/Hide Tabs at the end of the tab strip - the tab may simply be hidden or scrolled out of view.

Why don't the charts change when I edit the filters?

They aren't meant to. The charts reload only when you select Update, so that setting a branch, a rep and a date range doesn't trigger three reloads.

I set the date range back two years and nothing older appeared.

The charts only read the last twelve months, counted back from the first of the current month. That limit is deliberate - it keeps the dashboard fast as your history grows. For older data, use a report rather than the dashboard.

Total Contracts doesn't match the date range I've set. Is it wrong?

No. Total Contracts is filtered by Branch and Customer only - the Date Range and Sales Rep filters don't apply to it, so it counts every rental contract for that branch and customer. The other three counts all respect the date range.

What is the No Sales Rep Assigned group?

Records with no sales rep on them. When you group by Sales Rep, they're collected into one group rather than dropped, so the totals still add up. A large slice there usually means accounts or quotes are being created without a rep.

Why does the activities chart put an activity in a different month from the quotes chart?

Because they're plotted on different dates. Activities are plotted against their Due Date, so a call logged in March and due in August appears in August. Quotes and accounts are plotted against their created date.

Can I get the numbers out into a spreadsheet?

Yes. Each of the three bar charts has a download icon beside its title that saves exactly what's plotted as a CSV, named after the chart. The lost quotes doughnut doesn't have one - group by Status and use the quotes chart's download if you need those figures.

Watch the Demo

Prefer to watch it? Step through the same screens here.